
Should investors still buy the STI, or build it themselves?
The Straits Times Index (STI), Singapore’s equity benchmark, enjoyed a standout year in 2025, delivering a return of 22.7%. This followed gains of 16.9% in 2024, a flat 2023 (-0.3%) and a modest 4.0% in 2022. The recovery has reinforced the narrative that Singapore equities stand to benefit from long-term macroeconomic tailwinds, including Asia-Pacific capital reallocation and the city-state’s role as a financial hub at the heart of the region.
That optimism, however, obscures a more uncomfortable reality. For most investors, buying the STI does not mean buying “Singapore Inc.” It means buying its banks.
The two dominant exchange-traded funds tracking the index – the Amova Singapore STI ETF (G3B.SI) and the SPDR Straits Times Index ETF (ES3.SI) are efficient, low-cost vehicles. Both use full physical replication, distribute dividends and exhibit minimal tracking error. G3B.SI is marginally cheaper, while ES3.SI benefits from deeper liquidity and a longer operating history.
Key differences between the two summarized below[1]:
| Item | ES3.SI | G3B.SI |
| ETF name | SPDR® Straits Times Index ETF | Amova Singapore STI ETF |
| Expense ratio | ~0.28% p.a. | ~0.24% p.a. |
| AUM | ~SGD 2.46 billion | ~SGD 1.20 billion |
| Replication method | Physical, full replication | Physical, full replication |
| Inception date | 11 April 2002 (SGX listing: 17 Apr 2002) | 24 February 2009 |
But the more consequential feature lies in what these funds actually own.
More than half of the STI is concentrated in just three stocks: DBS, OCBC and UOB. This is not a quirk of ETF construction but a direct consequence of the index’s design. Full replication simply mirrors that concentration.
This raises a simple but uncomfortable question: if half your portfolio performance is driven by three banks, is the diversification you are paying for real– or merely cosmetic?
| Constituent Weighting | STI Index | G3B.SI | ES3.SI |
| DBS Weight | ~26.4% | ~25.9% | ~25.9% |
| OCBC Weight | ~15.0% | ~13.6% | ~14.7% |
| UOB Weight | ~10.1% | ~10.8% | ~9.9% |
| Combined Banks | ~51.5% | ~50.3% | ~50.5% |
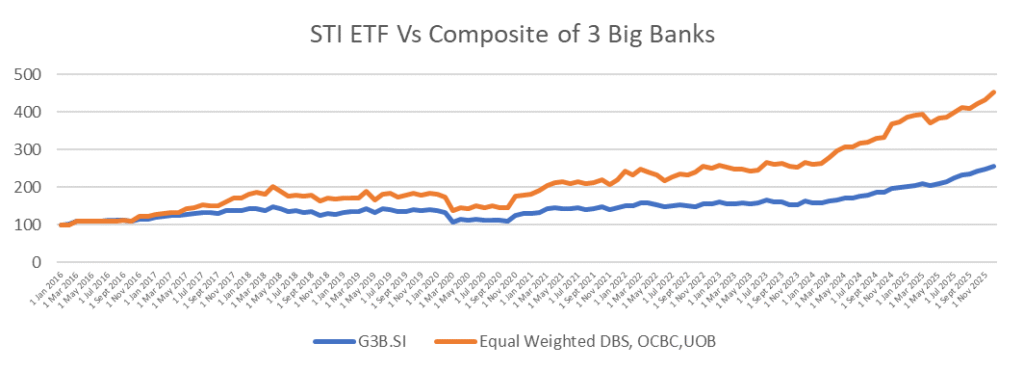
Over the 10 years to December 2025, the STI delivered annualised returns of approximately 9.9%. Over the same period, DBS returned 22.1% per year, OCBC 14.9% and UOB 12.0%. An equal-weighted portfolio of the three banks– without any index constituents beyond them– generated annualised returns of 16.5%.
Even after adjusting crudely for risk (using return per unit of volatility), the picture is similar. The equal-weighted bank portfolio outperformed the STI ETF on a risk-adjusted basis, as did DBS and OCBC individually.
| Amova Singapore STI ETF SGD | DBS Group Holdings | Oversea-Chinese Banking Corporation Limited | United Overseas Bank Limited | Equal Weighted DBS, OCBC, UOB | |
| Ann Return 10 year (apprx) | 9.9% | 22.1% | 14.9% | 12.0% | 16.5% |
| Ann Stdev 10 year (apprx) | 13.0% | 20.5% | 16.2% | 17.9% | 17.3% |
| Return/Vol 10 year | 0.76 | 1.08 | 0.92 | 0.67 | 0.96 |
More telling still is correlation. Over the past decade, returns on the STI ETF have shown roughly 0.9 correlation with the equal-weighted bank portfolio. In practice, this means that close to 90% of the index’s movements can be explained by the three banks alone.
| Correlation | Amova Singapore STI ETF SGD (G3B.SI) | DBS Group Holdings | Oversea-Chinese Banking Corporation Limited | United Overseas Bank Limited | Equal Weighted DBS, OCBC, UOB |
| Amova Singapore STI ETF SGD (G3B.SI) | 1.00 | 0.87 | 0.87 | 0.85 | 0.91 |
Let’s say you counter with this:
The three banks have done well historically, but in the future this sector as a whole might not do well for industry wide or idiosyncratic reasons – an elaborate way of saying the other 50% of my STI ETF holdings might shine in the next decade and make up for any dismal performance from the banks.
But here’s a fun fact, from 2016 to 2025, there were only 5 months in which the STI ETF delivered positive returns when an equal weighted composite of the three banks posted losses. In other words, a decade of history suggests that 88% of the times your STI ETF will lose money when your DBS-OCBC-UOB equal weighted portfolio tanks! This is one set of eights of that does not sound very propitious.
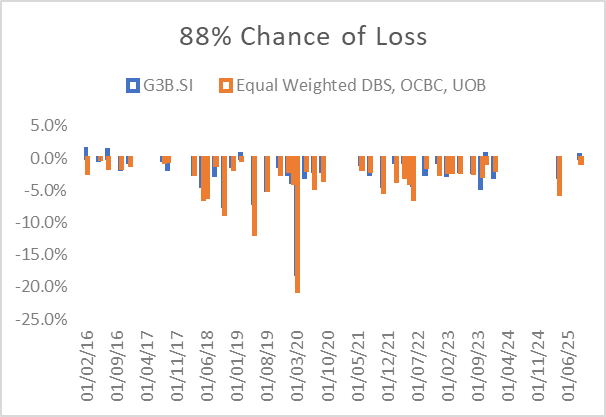
The Covid market shock offers a useful stress test. In March 2020, the equal-weighted bank portfolio fell 20.6%. The STI ETF fell 18.1%. The non-bank half of the index softened the blow only marginally.
This is not an argument against Singapore’s banks. Nor is it a claim that the STI will underperform in the decade ahead. It is, instead, a challenge to passive complacency.
If investors are comfortable with heavy exposure to DBS, OCBC and UOB– and many are– they should at least be honest about what they own. Paying ongoing fees for diversification that rarely diversifies may not be the optimal trade-off.
So is there a better way to build Singapore equity exposure?
Stay tuned for Part 2
[1] As of 03 Jan 2026
Data from yfinance, analysis conducted with Python 3

Leave a Reply